An overview of the deliverables of the ACAEM© method. All these deliverables exist and have been used in real-world settings. The examples shown here are anonymised and illustrated with fictitious data. In a meeting, we show you the real mechanics applied to your situation.

One page that says where adoption stands, which risks are rising, and which decisions the sponsor needs to take to the committee. Not an activity report: a decision tool.
Steering note · March 2026 (fictitious data)
/ 100
Success confidence index
Where adoption stands
Overall adoption at 61%, up 9 points over the month. The Operations switchover is under way; the Finance area is lagging. 12 active internal relays, 3 still to be mobilised in Geneva.
Rising risks
Low visibility of the Finance sponsor: the area’s buy-in depends on it.
Training workload underestimated for two business populations.
Decisions to take this month
Make the Finance sponsor visible at a key moment. Decide on additional training support. Approve the Geneva switchover plan.
The month’s decision narrative
The note fits on one page. It is written for the sponsor, not for the project team: it does not list activities, it informs decisions.
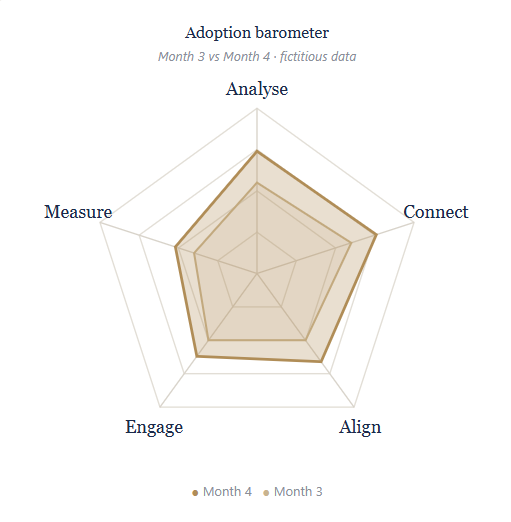
Each month, adoption is scored on each of the framework’s five dimensions. Progress, or stalling, shows up in figures rather than impressions.
Measurement, dimension by dimension
Each dimension of the framework receives a score, recorded every month. You can see at a glance what is progressing and what is lagging.
This month’s reading: all dimensions progress between month 3 and month 4. Measure and Align remain the lowest; they are the focus of next month’s action plan.
Combined with the steering note, the barometer turns steering into decisions rather than impressions.
A readout is not a survey: it is the raw material for scoping. It turns what teams say into a shared reading, and feeds the impact map, the engagement plan and the measurement plan.
semi-structured interviews
populations, cross-referenced by role
see centralised information as a key benefit
want live training with an expert
The pain points, in their own words
Anonymised verbatims, grouped by type of friction (translated from French)
Traceability
“We don’t know who has the invoice, or what stage it’s at.”
Channels
“Sometimes I get the invoice by email, sometimes on paper.”
Process
“Some people play along, others don’t: people outside the process who shouldn’t be.”
Time
“We lose time: we have to chase the supplier when information is missing.”
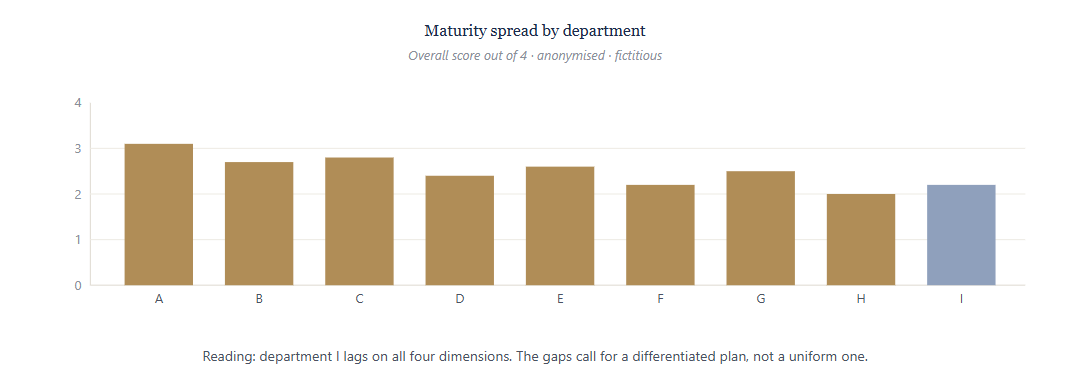
Applied here to an industrial group: 55 interviews across 9 departments, scored on the instrument’s four dimensions to establish the starting point and calibrate the effort.
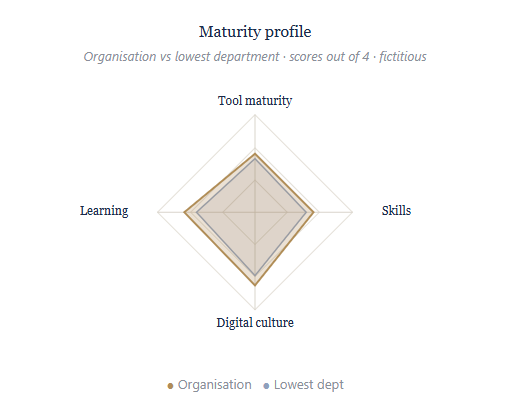
What this profile tells the sponsor
The diagnostic turns scores into decisions. Across 55 interviews:
These examples are anonymised and illustrative. In a meeting, we show you how these deliverables apply to your situation.